
1
Please refer to important disclosures at the end of this report
1
1
Angel Top Picks – August 2020
Indian equities outperformed global markets for the second month in a row –
Indian equities outperformed for the second month in a row with the Nifty rallying
by 7.5% for the month as compared to the Dow Jones which was up by 2.4%. FII
flows were positive for the third month in a row at `7,563 crore though it slowed
down significantly from `21,831 in June. Markets were also supported by better
than expected Q1FY2021 numbers so far led by the IT sector.
Global economy improved further in July – Global economy improved further in
July with the US manufacturing PMI increasing to 50.9 from 49.8 in June. This was
despite states delaying or rolling back their reopening plans due to sharp increase
in new Covid-19 cases. Other major economies too reported improvement in
manufacturing activities for July. China manufacturing PMI improved to 52.8 from
51.3 in June while German and French manufacturing PMI improved to 51.0 and
52.4 from 50.0 and 52.0 respectively in June.
Domestic economy too accelerated in July – The economy continued to improve
through July despite localized lockdowns which was reflected in high frequency
data like Auto sales and PMI numbers. Auto companies reported another month of
strong sequential growth with Maruti Suzuki reporting a 1.1% yoy increase in July
domestic sales as compared to a 53.7% degrowth in June. Similarly Hero
Motocorp also reported a 14% sequential growth in motorcycle sales. The
manufacturing PMI was marginally down to 46.0 from 47.2 in June though it’s up
significantly from 27.4 in May.
Pent up demand and inventory build up to sustain economic activity in short term –
Though there has been significant improvement in economic activities over the
past few months, there are concerns on the durability of the recovery given job
losses especially in the informal sector. Due to lockdowns in April and May there is
pent up demand which along with inventory buildup prior to the festive season and
opening up of the services sector should lead to further improvement in economic
activities over the next couple of months. However there is a possibility of a
slowdown post the festive season once the pent up demand is exhausted which
may lead to increased market volatility down the line.
Bottom up stock picking will be the key to generate alpha going forward – Though
the economy has improved significantly from April and is likely to improve further
from current levels over the next few months, there is a possibility of slowdown post
the festive season. Therefore, while we remain positive on the markets from a
longer term perspective we feel that investors should be judicious in their stock
selection from here on and should focus on companies with high quality business
franchises which have strong revenue visibility going forward.
Top Picks Performance
Return Since Inception (30th Oct, 2015)
Top Picks Return
67.2%
BSE 100
36.5%
Outperformance
30.7%
Source: Company, Angel Research
Top Picks
Company
CMP (`)
TP (`)
FMCG
Britannia Industries
3,817
4,220
Healthcare & Pharma
IPCA Laboratories
1,987
2,400
Dr Reddy's Lab
4,634
5,000
Alembic Pharma
1,017
1,400
IT
L&T Infotech
2,447
2,838
Persistent System
951
1,085
Zensar Technologies
174
204
Chemicals/Agrochemicals
PI Industries
1,831
2,087
Galaxy Surfactants
1,661
1,800
Aarti Industries
1,043
1,165
Telecom/Others
Bharti Airtel
549
672
Reliance Industries
2,151
2,277
Banking
ICICI Bank
351
410
HDFC Ltd
1,780
2,075
IDFC First Bank
27
32
Others
Endurance Technologies
927
1,110
Swaraj Engines
1,398
1,665
Source: Company, Angel Research
Note: Closing price as on 4th August,2020

2
Error!
Refer
ence
sourc
Angel Top Picks | August 2020
August 5, 2020
2
Top Picks
3
Error!
Refer
ence
sourc
Angel Top Picks | August 2020
August 5, 2020
3
Alembic Pharma
31% of revenue comes from domestic Branded business and API business
contributes 15.4%. We expect Alembic Pharma Ltd. (Apll) to grow its top line
by 15-17% in the upcoming years.
Company has incurred large capex in infrastructure in the last couple of years.
New product launches and volume growth will help US business to grow by
10-15% p.a for next couple of years. Currently, Apll has 119 approved ANDA
out of which 60 yet to be commercialized.
Apll will be going to launch several products in the domestic market and 15
products in the US market. Apll already launch 3 products in Q1FY21 and
expected to launch 5 products in Q2FY21.Out of 5 formulation plants and 2
API plants, apll has no observation from USFDA
Key Financials
Y/E
Sales
OPM
PAT
EPS
ROE
P/E
P/BV
EV/Sales
March
(` cr)
(%)
(` cr)
(`)
(%)
(x)
(x)
(x)
FY2021E
5595
25.4%
980
51.6
24.4
19.8
5.8
3.6
FY2022E
6188
24%
981
51.6
21
20
5.5
3.3
Source: Company, Angel Research
Dr Reddy’s Lab
Dr Reddy’s has a very strong product portfolio with 55%-65% of its revenue
coming from its chronic which is a high growth segment and will be least
impacted due to lockdown globally.
The company has a very healthy US pipeline with 99 ANDA’s pending
approval from the US FDA including 30 FTF’s. The company intends to launch
25 new products FY21.
DRL has incurred large capex over last 5 years with net block increasing from
INR 5380cr in 2015 to INR 9300cr in 2020. With current capacity utilization at
50% we do not envisage any significant capex for the company going forward.
DRL has acquired domestic business of Wockhardt pharma for 1414cr, deal
was completed in last month of Q1FY21. DRL will get 62 brands with total
annual sales of 1830cr which we believe is value accretive for the company.
Key Financials
Y/E
Sales
OPM
PAT
EPS
ROE
P/E
P/BV
EV/Sales
March
(` cr)
(%)
(` cr)
(`)
(%)
(x)
(x)
(x)
FY2021E
18840
23.5%
2705
166.6
30.5
27.8
4.3
3.4
FY2022E
20855
24.8%
3137
192.6
32
24
3.8
3.1
Source: Company, Angel Research
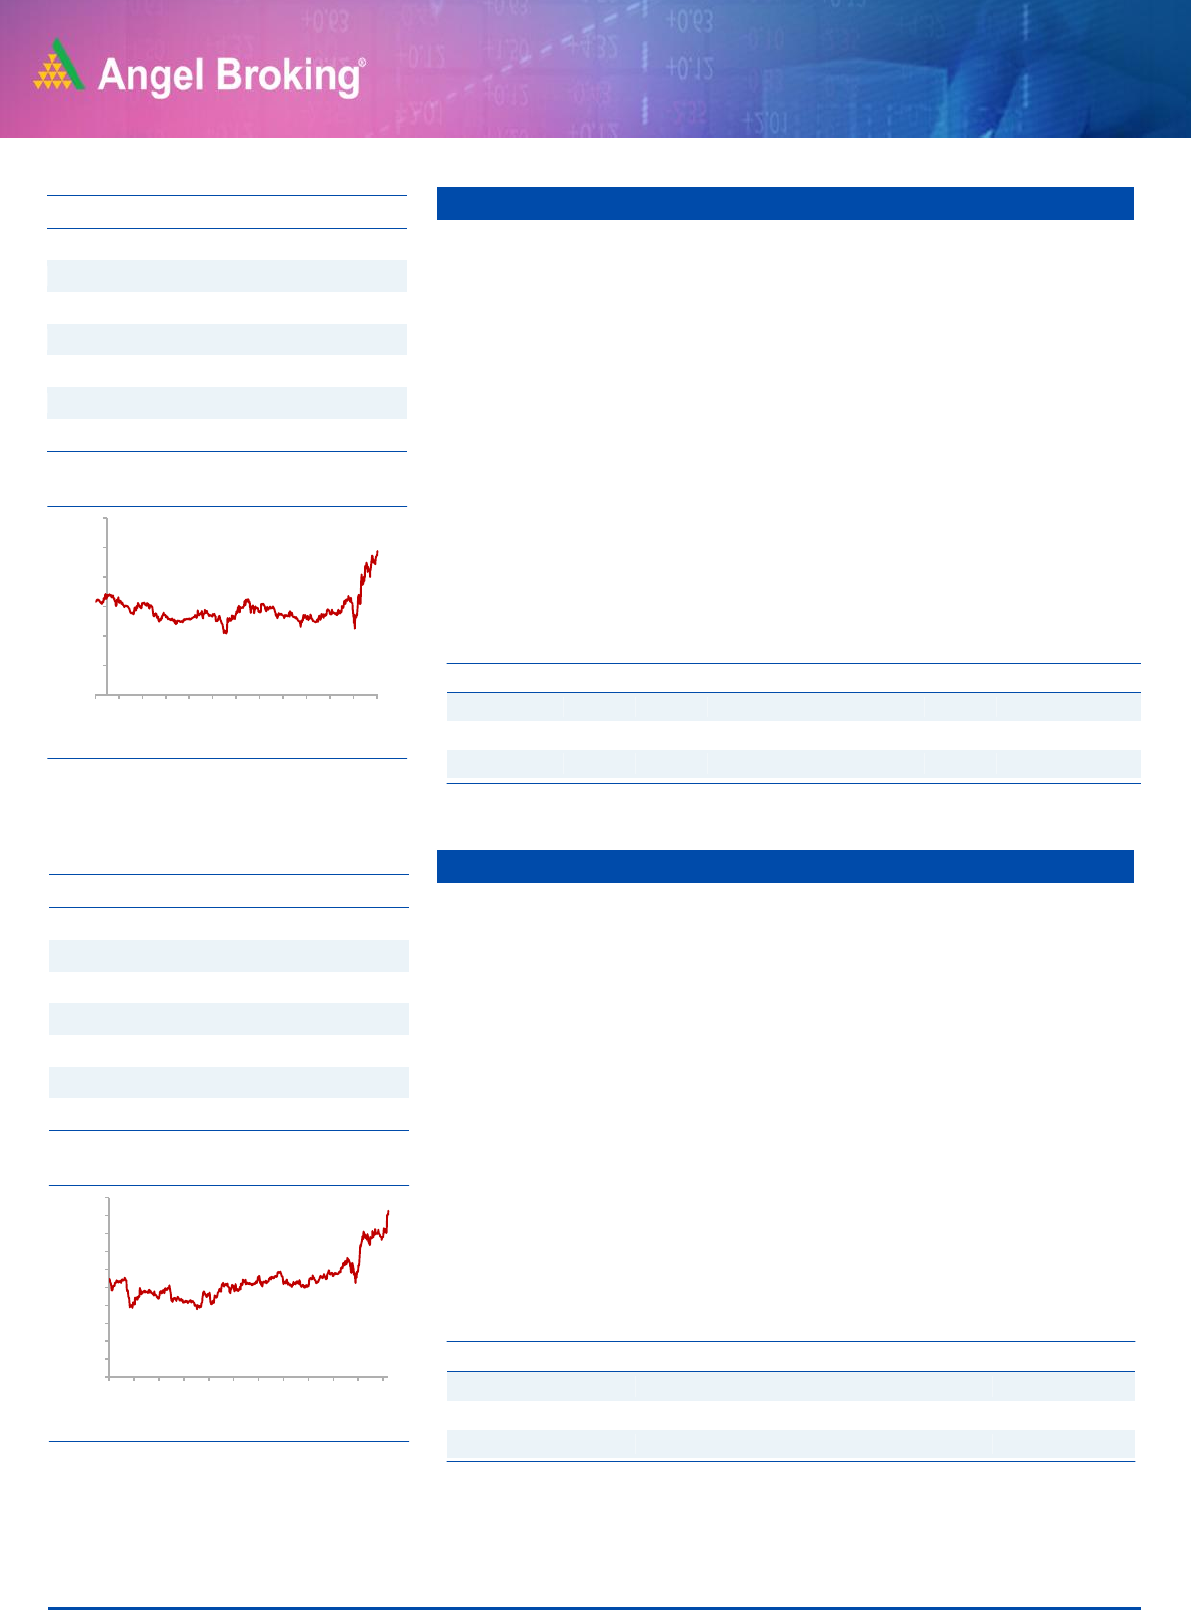
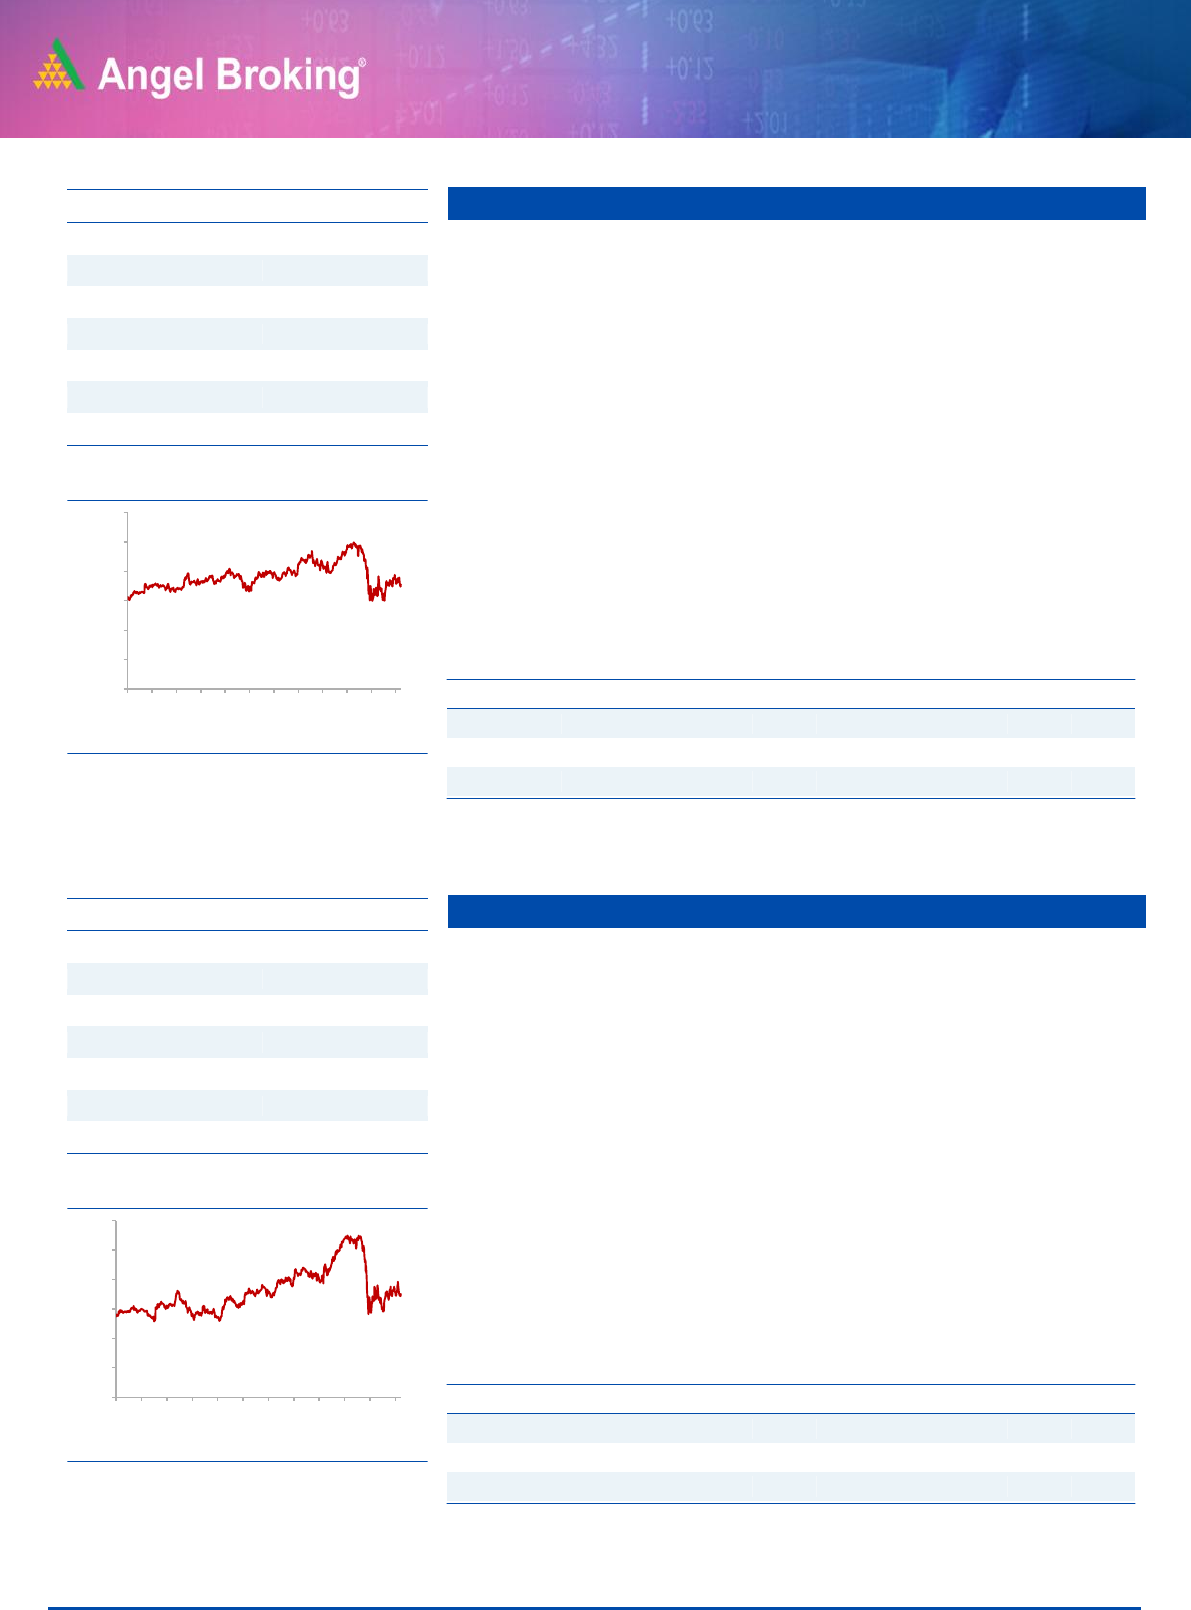
Stock Info
CMP
1,017
TP
1,400
Upside
37.7%
Sector
Pharmaceutical
Market Cap (` cr)
19,173
Beta
0.7
52 Week High / Low
1,044/436
3 year-Chart
Source: Company, Angel Research
-
200
400
600
800
1,000
1,200
Aug-16
Dec-16
Apr-17
Jul-17
Nov-17
Mar-18
Jul-18
Nov-18
Mar-19
Jul-19
Nov-19
Mar-20
Jul-20
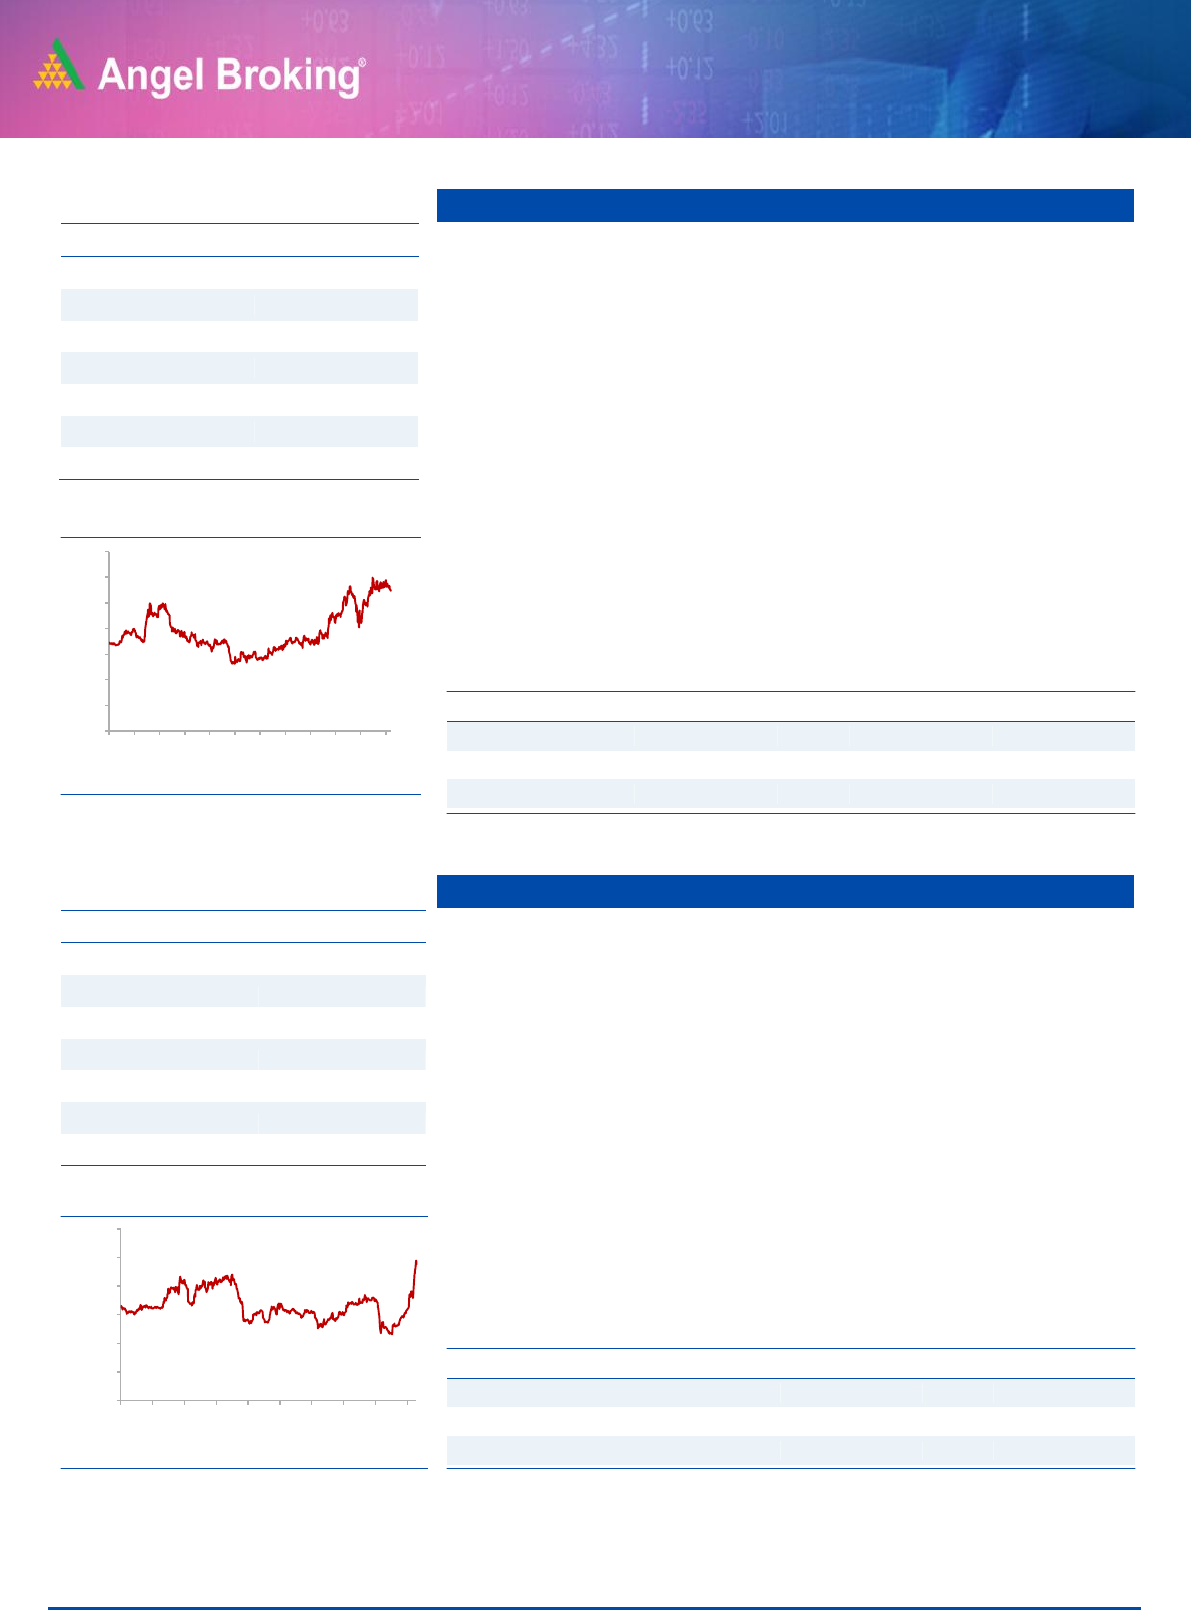
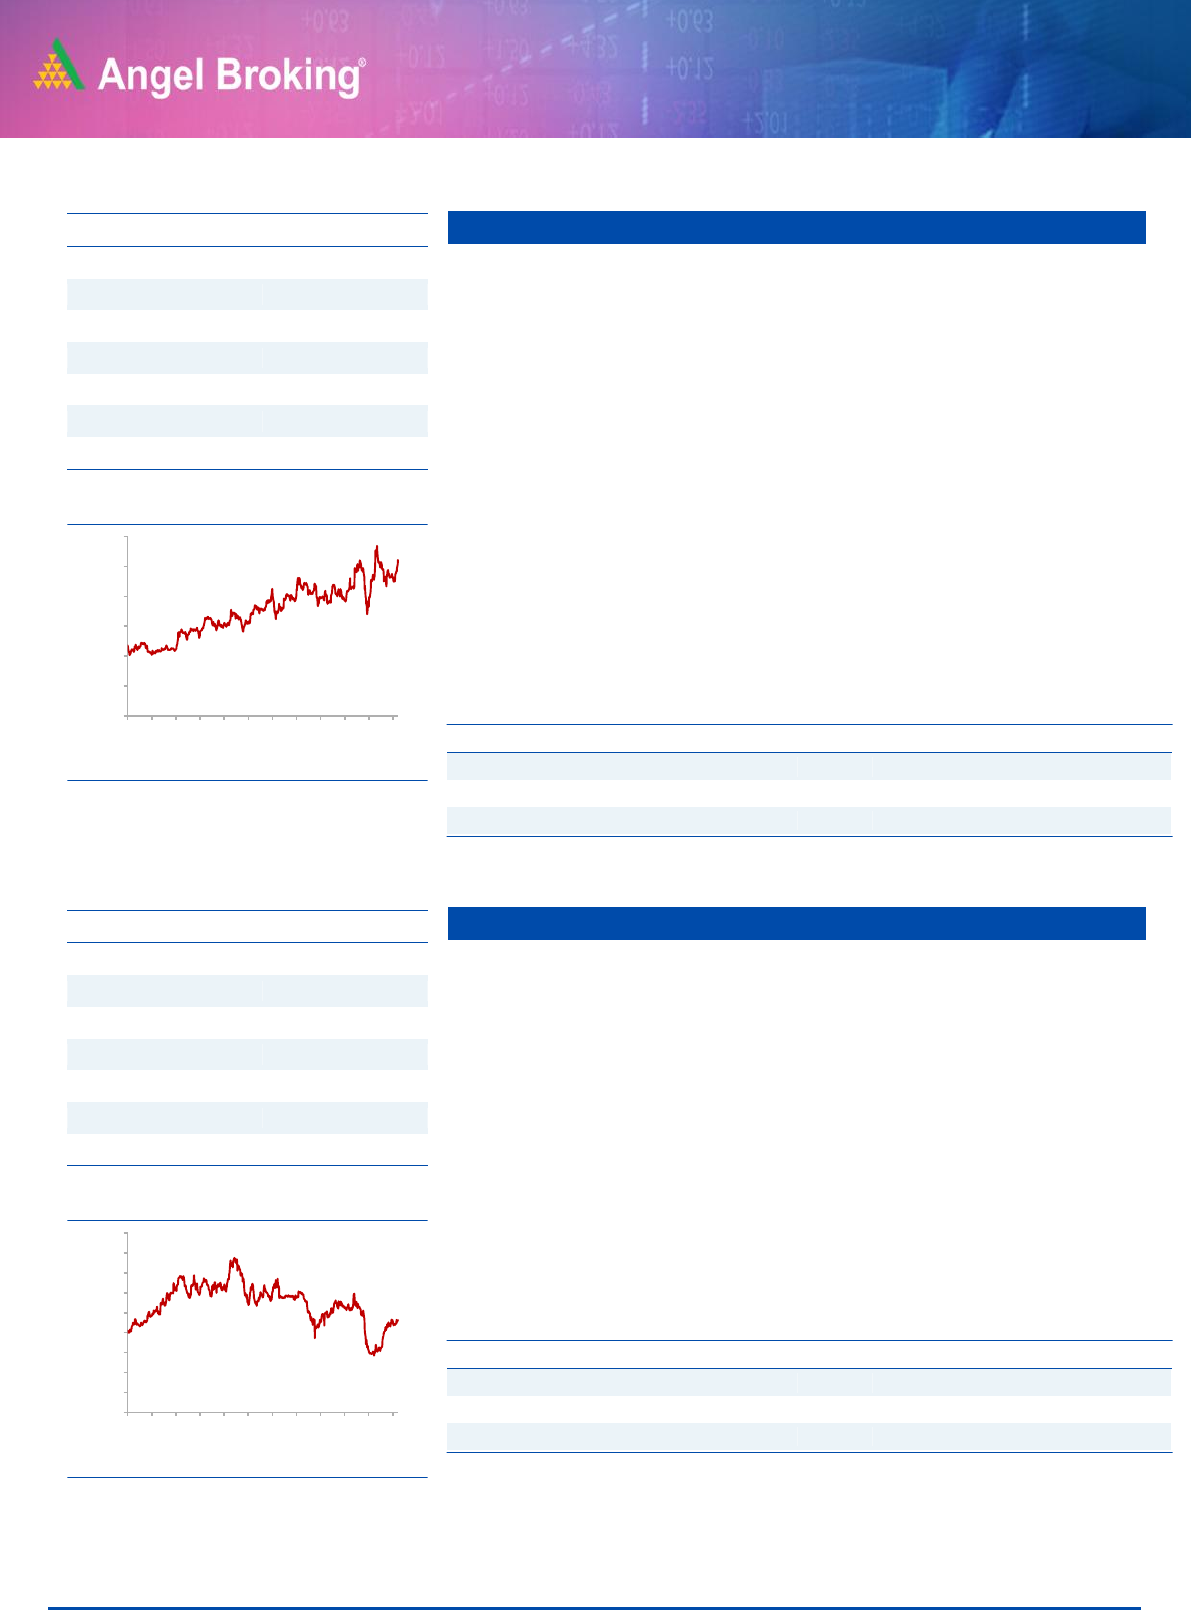
Stock Info
CMP
4,634
TP
5,000
Upside
7.9%
Sector
Pharma
Market Cap (` cr)
77,037
Beta
0.5
52 Week High / Low
4,666/2,352
3 year-Chart
Source: Company, Angel Research
-
500
1,000
1,500
2,000
2,500
3,000
3,500
4,000
4,500
5,000
May-17
Aug-17
Dec-17
Mar-18
Jul-18
Oct-18
Feb-19
May-19
Sep-19
Dec-19
Mar-20
Jul-20
4
Error!
Refer
ence
sourc
Angel Top Picks | August 2020
August 5, 2020
4
Bharti Airtel
There is going to be some impact on subscribers from the low income group
especially daily wage earners due to the lockdown. However a sharp increase
in data consumption should make up for a significant portion of the loss.
Therefore we expect limited impact on Bharti from the lockdown.
Bharti has raised capital of USD 2bn from a QIP at `445 per share along with
FCCB issues of USD 1bn in January 2020. Therefore Bharti is much better
placed as compared to Vodafone Idea in terms of liquidity.
Telecom operators have increased tariffs by ~35% in Nov’19. There is a
possibility of another round of tariff hikes by telecom companies in FY21 given
that tariffs are still very low. If this were to happen then it would lead to further
upsides to our estimates for FY21 and FY22.
Even if there is no major tariff hike in FY21 and Vodafone Idea goes out of
business, Bharti would benefit significantly from addition of subscribers.
Key Financials
Y/E
Sales
OPM
PAT
EPS
ROE
P/E
P/BV
EV/Sales
March
(` cr)
(%)
(` cr)
(`)
(%)
(x)
(x)
(x)
FY2021E
102143
44.4
-12655
-25.1
-21.6
-21.9
4.7
3.2
FY2022E
115213
45.8
6690
10.0
7.9
55.0
4.3
2.7
Source: Company, Angel Research
Persistent System
Persistent Systems has a very strong presence in Hi tech, manufacturing and
life science segments which ware amongst the least impacted sectors due to
Covid-19.
Company has posted a very strong set of numbers for Q1FY21 with dollar
revenue growth of 3.1% qoq. Company has also reported improvement in
margins due to tight cost control. Company has won a large deal during the
quarter which will ramp up over the next few quarters. The new management
focus on annuity deals are expected to lead to stable growth going forward.
We expect the company to post revenue/EBITDA/PAT growth of
11.6%/21.4%/19.7% between FY20-FY22 given negligible impact of Covid-
19 on FY21 numbers, strong deal wins, ramp up of existing projects along
with margin expansion.
Key Financials
Y/E
Sales
OPM
PAT
EPS
ROE
P/E
P/BV
EV/Sales
March
(` cr)
(%)
(` cr)
(`)
(x)
(%)
(%)
(x)
FY2021E
4,159
15.3
415
54.3
15.4
17.5
2.7
1.3
FY2022E
4,756
15.3
488
63.8
15.9
14.9
2.4
1.1
Source: Company, Angel Research (Standalone nos.)
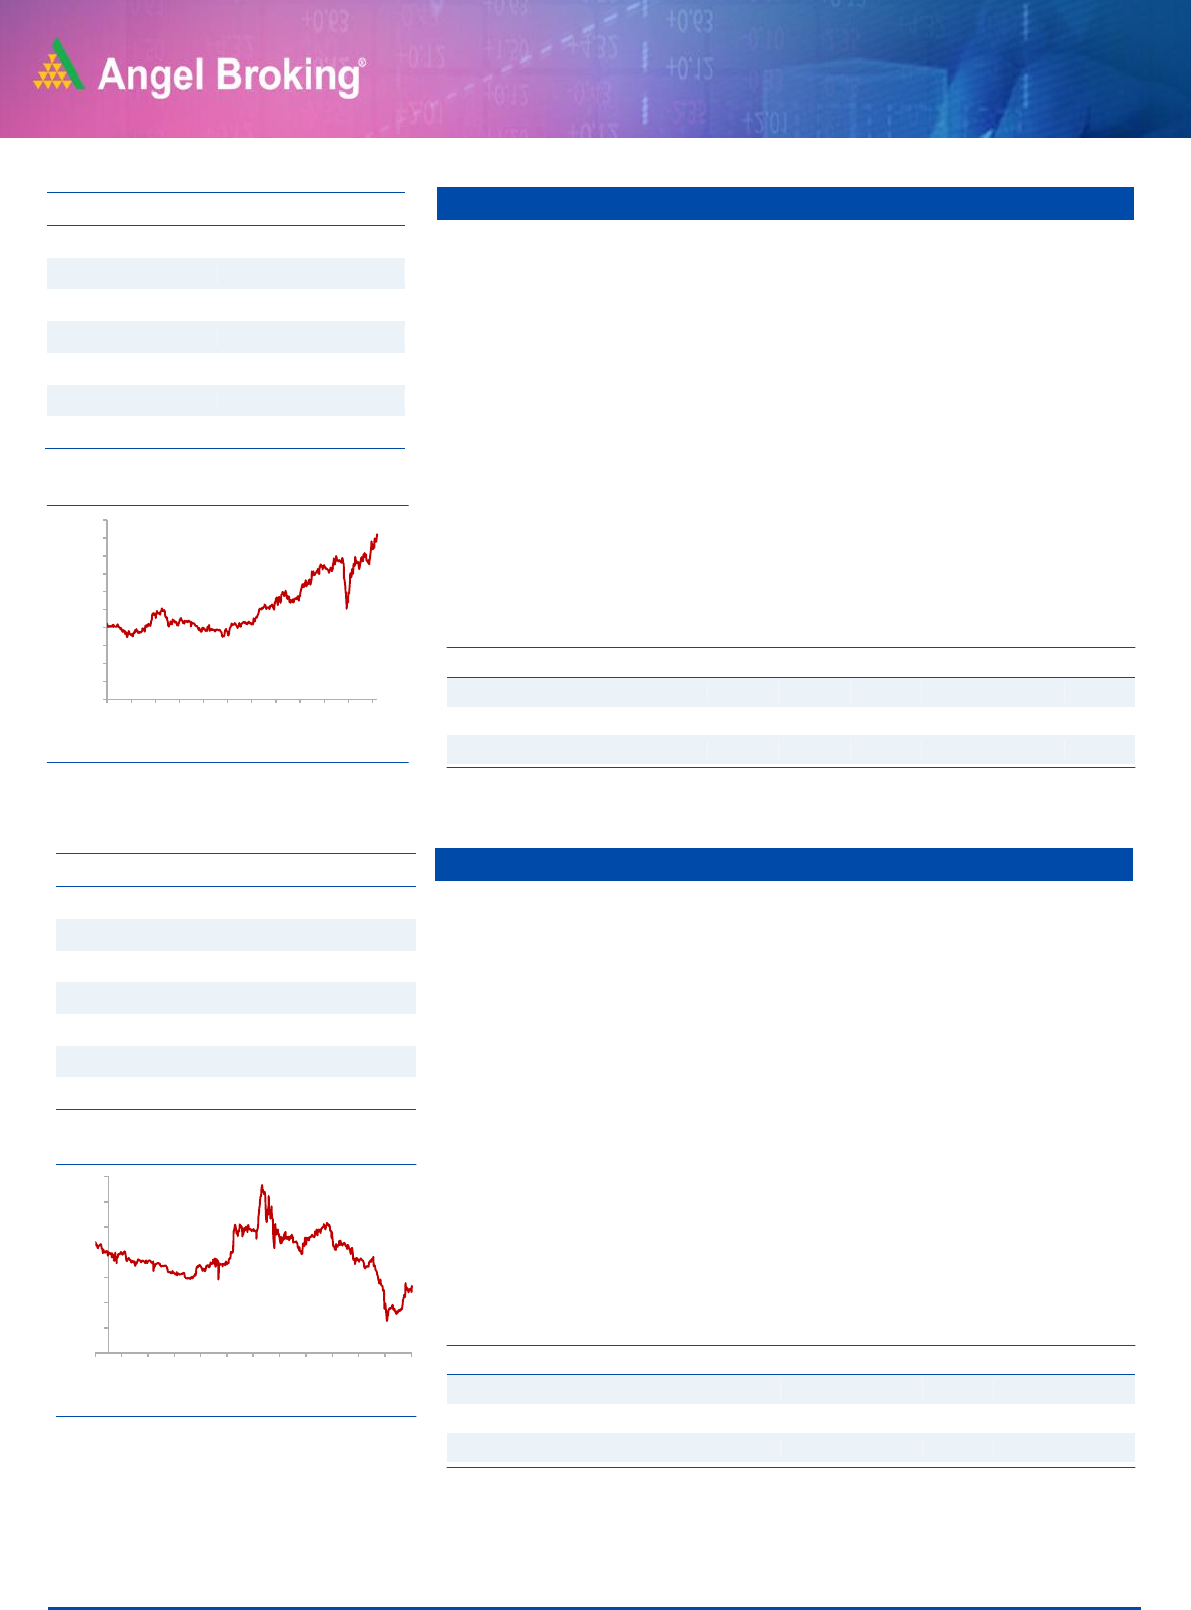
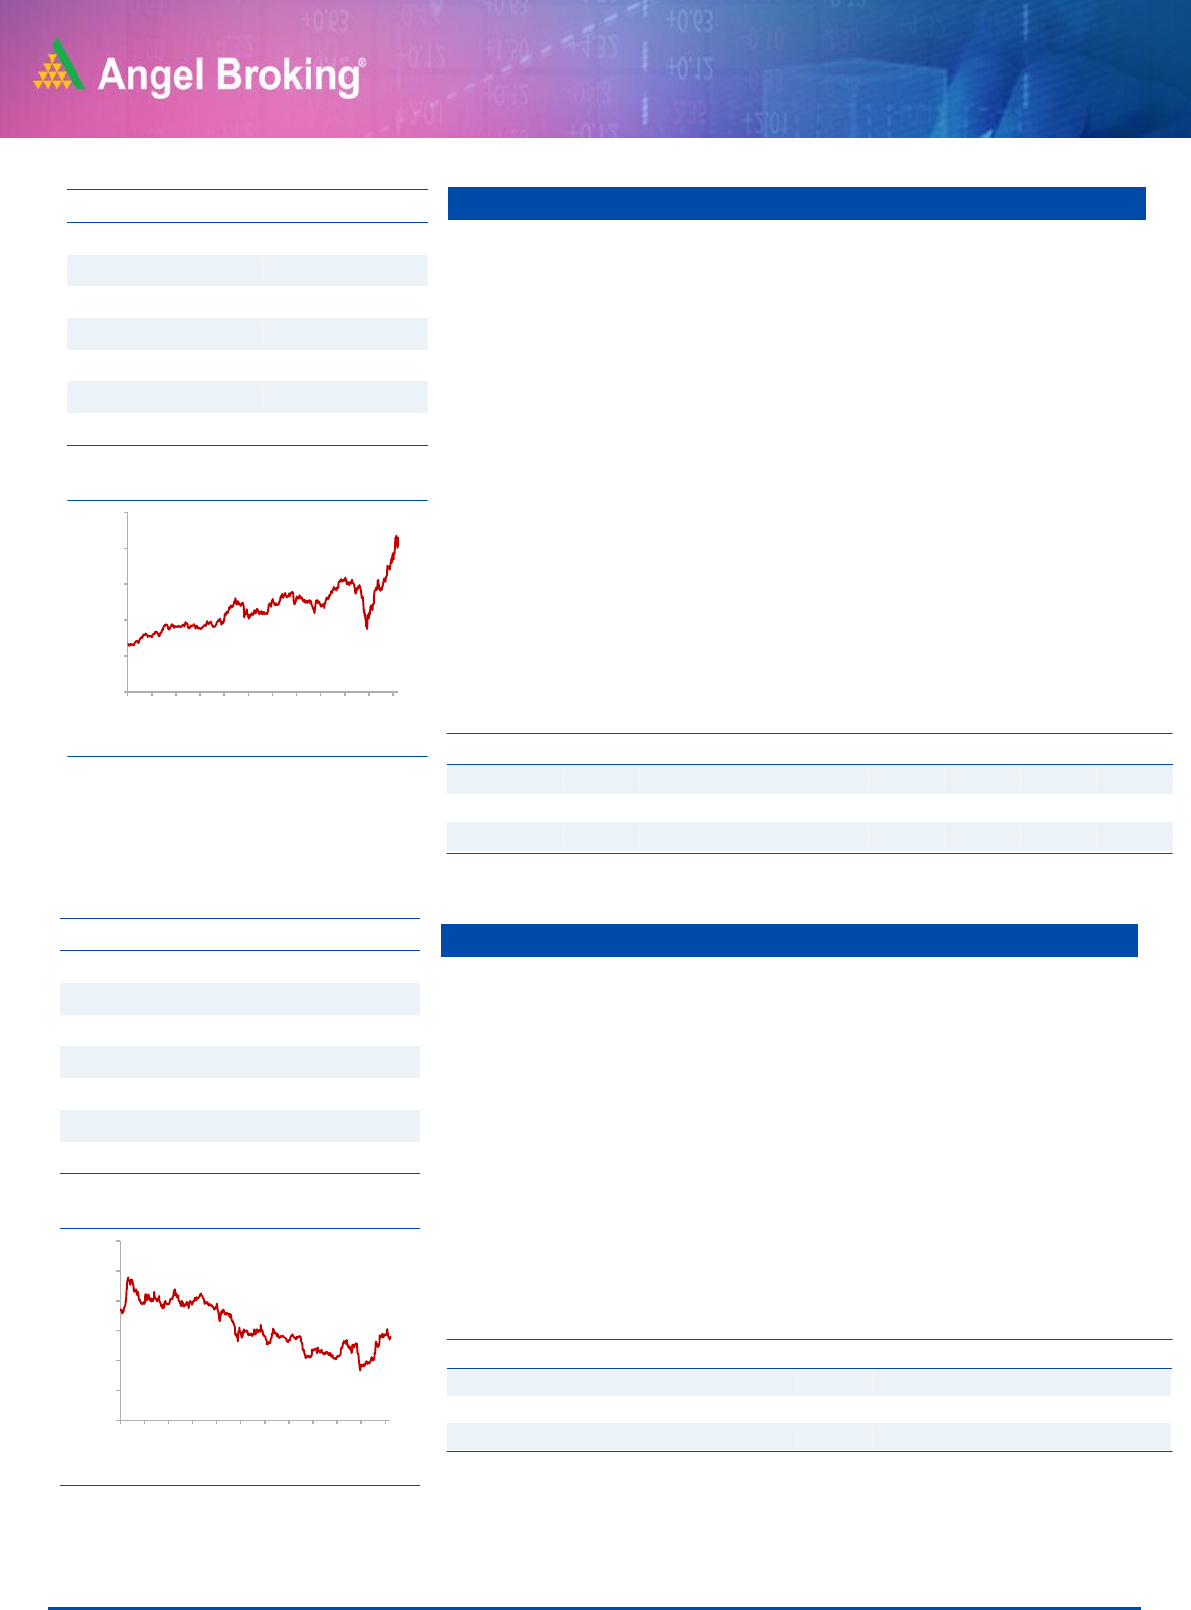
Stock Info
CMP
951
TP
1,085
Upside
14.1%
Sector
IT
Market Cap (` cr)
7,265
Beta
0.4
52 Week High / Low
1,040/420
3 year-Chart
Source: Company, Angel Research
-
200
400
600
800
1,000
1,200
Jul-17
Nov-17
Mar-18
Jul-18
Nov-18
Mar-19
Jul-19
Nov-19
Mar-20
Jul-20
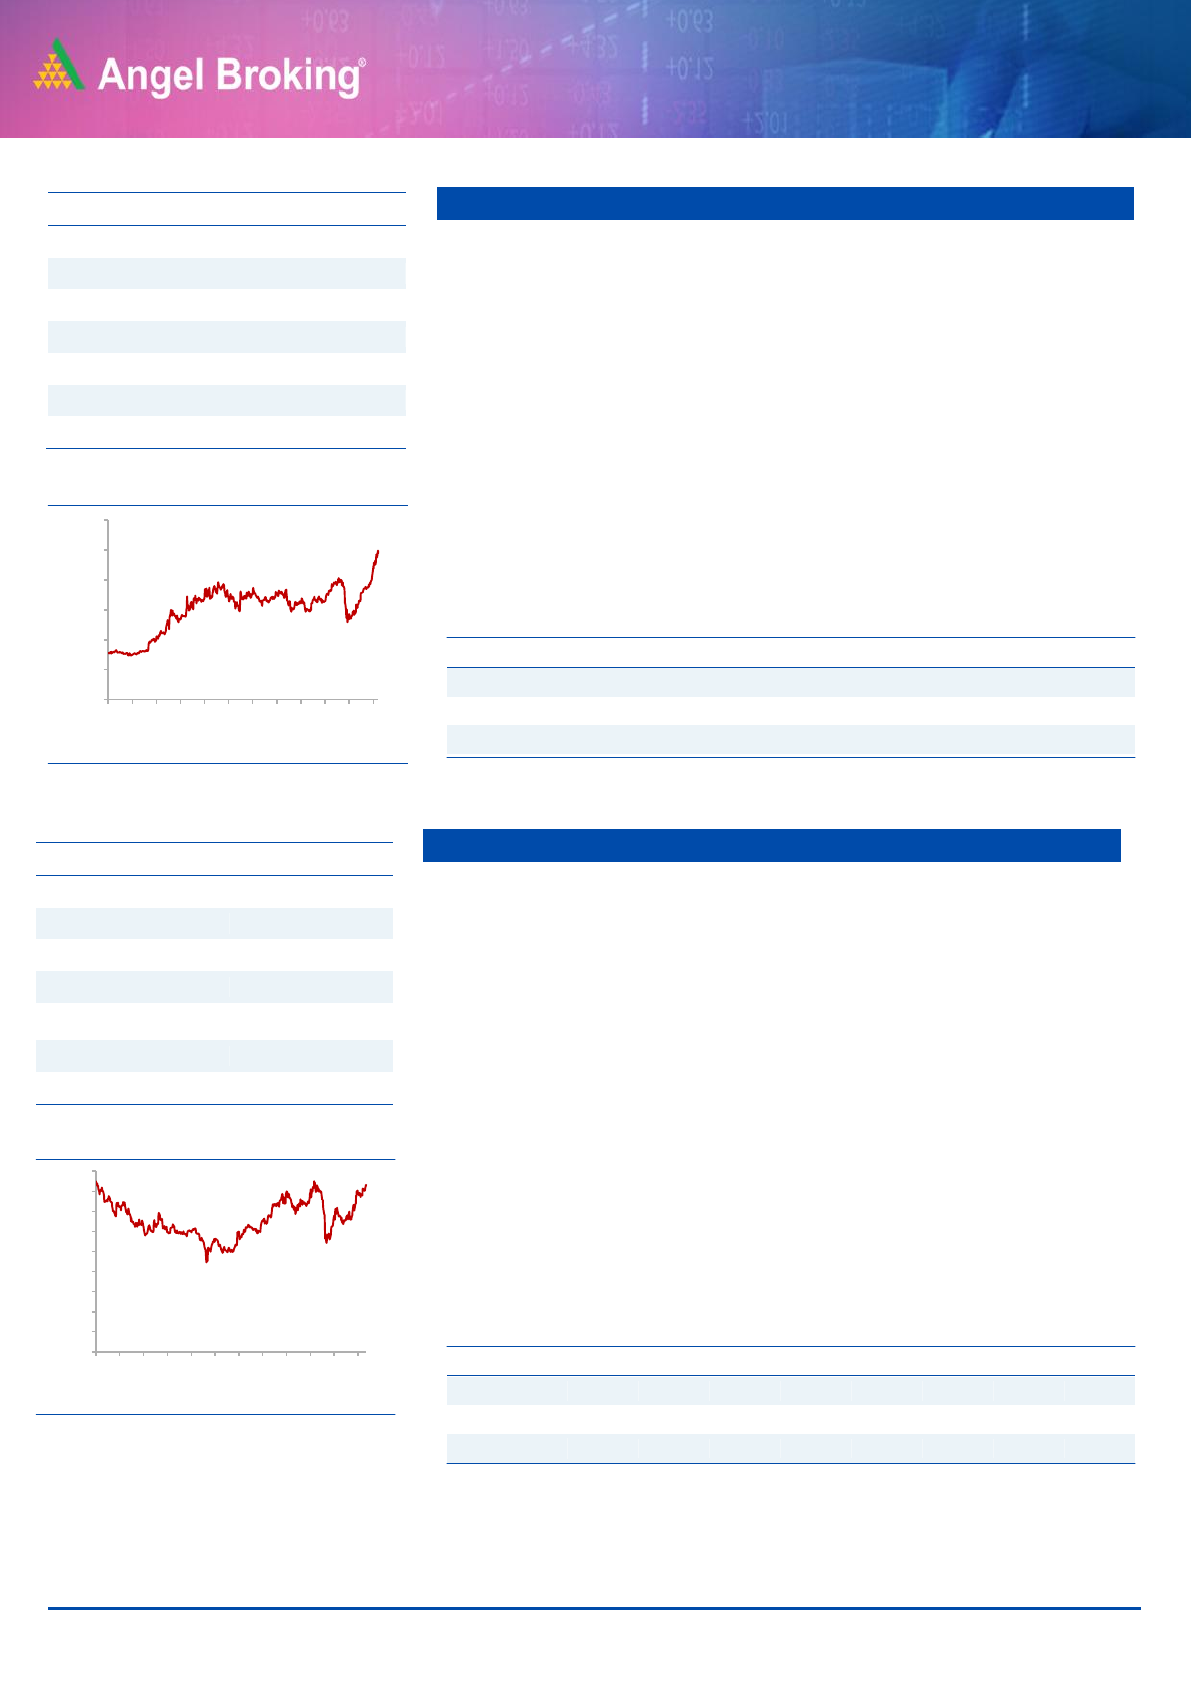
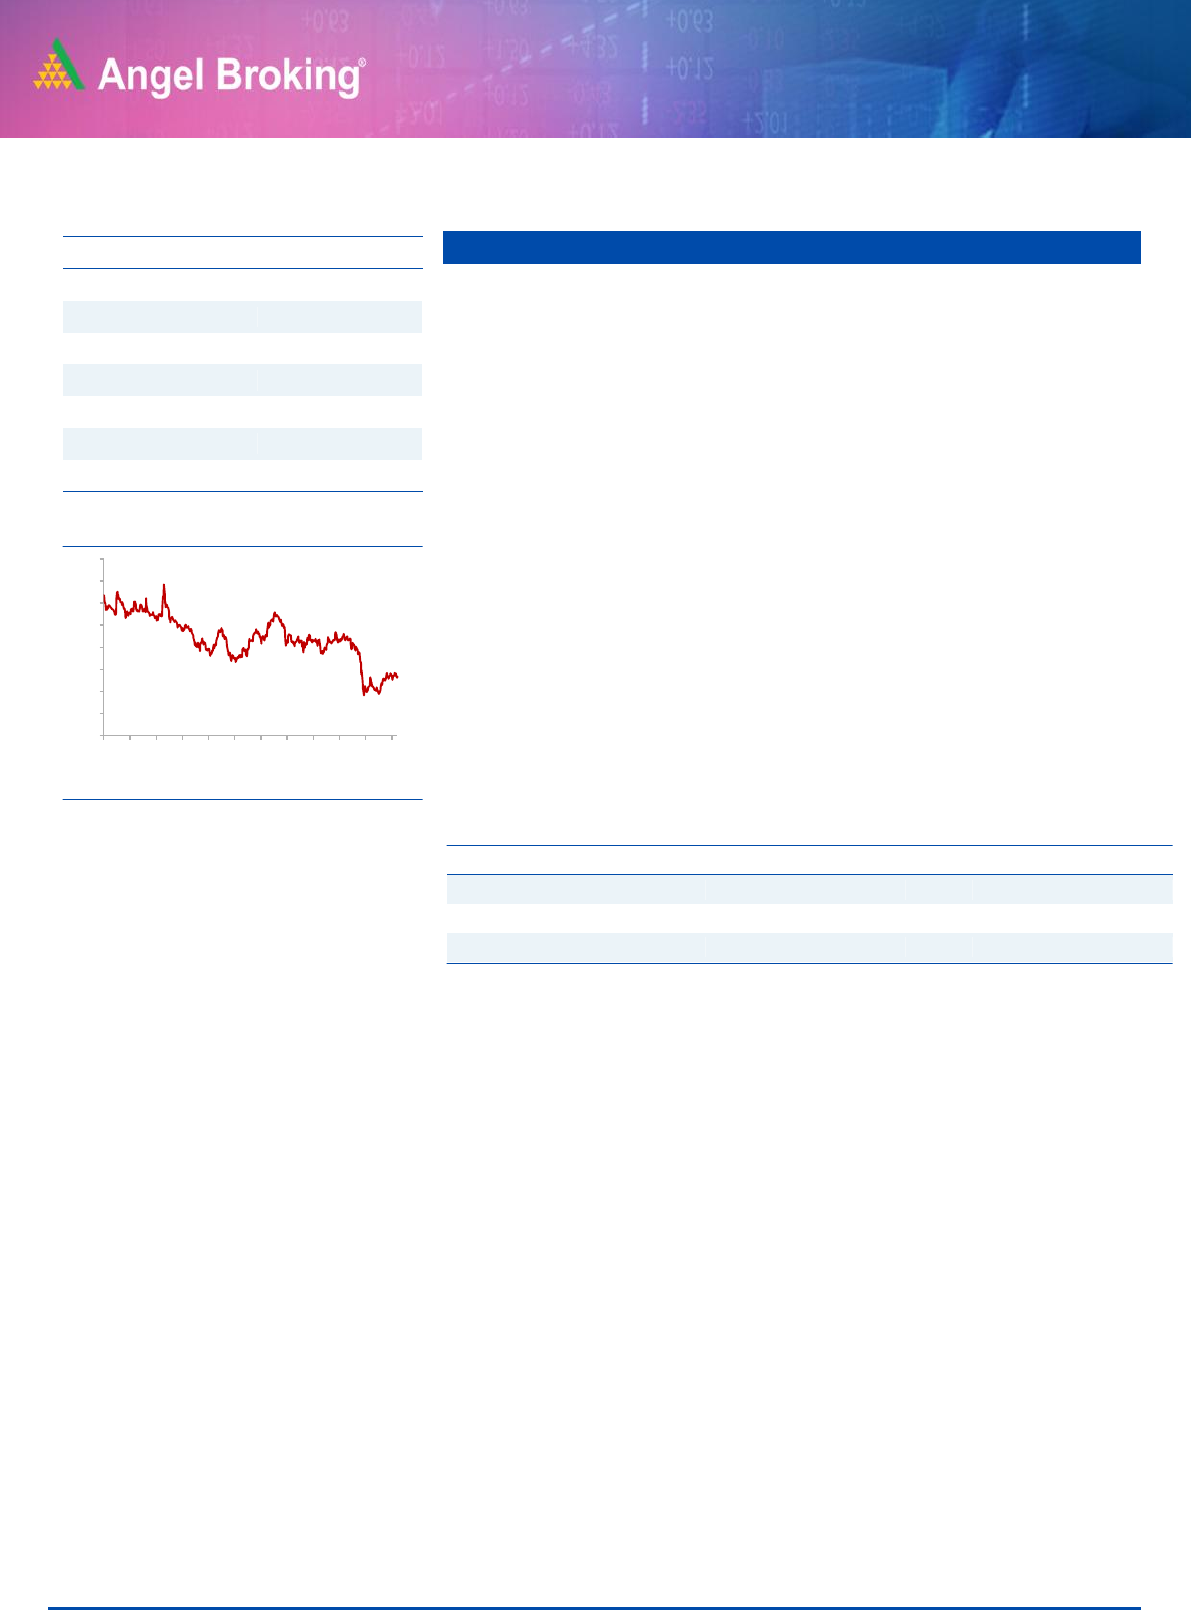
Stock Info
CMP
549
TP
672
Upside
22.4%
Sector
Telecom
Market Cap (` cr)
299,400
Beta
0.8
52 Week High / Low
611/325
3 year-Chart
Source: Company, Angel Research
-
100
200
300
400
500
600
700
May-17
Aug-17
Dec-17
Mar-18
Jul-18
Oct-18
Feb-19
May-19
Sep-19
Dec-19
Mar-20
Jul-20
5
Error!
Refer
ence
sourc
Angel Top Picks | August 2020
August 5, 2020
5
PI Industries Ltd.
PI Industries is a leading player in providing Custom synthesis and
manufacturing solutions (CSM) to global agrochemical players. The CSM
business accounted for 72% of the company’s revenues in FY20 and is
expected to be the key growth driver for the company in future
The company has been increasing its share of high margin CSM business
driven by strong relationship with global agrochemical players. PI is leveraging
its chemistry skill sets and is looking to diversify its CSM portfolio to electronic
chemicals, Pharma API, fluoro chemicals, etc. which will help drive business.
Management has provided strong growth guidance for FY2021 despite
uncertainties over the Covid-19 situation drive by both the CSM and Indian
agrochemical business. The company is also raising capital to augment
capacity which will drive the next leg of growth for the company.
Key Financials:
Y/E
Sales
OPM
PAT
EPS
ROE
P/E
P/BV
EV/Sales
March
(` cr)
(%)
(` cr)
(`)
(%)
(x)
(x)
(x)
FY2021E
4,366
22.6
653
47.3
20.1
38.7
3.9
5.8
FY2022E
5,457
22.7
823
59.6
20.7
30.7
3.2
4.6
Source: Company, Angel Research
Zensar Technologies
Zensar Technologies is one of the leading IT service providers to the High tech
verticals. The company has a very strong presence in Hi tech and
manufacturing which ware amongst the least impacted sectors due to Covid-
19.
Company was adversely impacted between FY18-20 due to ramp down in the
retail and consumer group segment share of which has gone down from
27.1% of revenues in FY2018 to 20.7% of revenues in FY2020. The consumer
group segment further degrew to 12.0% of revenues in Q1FY2021.
Company has won deals worth USD 150mn during the quarter and
management has said that deal pipeline is very strong at USD 1.5bn as
compared to USD 1.0bn a quarter ago.
We expect the company to post revenue/EBITDA/PAT growth of
4.5%/17.8%/19.7% between FY20-FY22 given that the worst is over for the
company in terms of client ramp downs.
Key Financials
Y/E
Sales
OPM
PAT
EPS
ROE
P/E
P/BV
EV/Sales
March
(` cr)
(%)
(` cr)
(`)
(%)
(x)
(x)
(x)
FY2021E
4,059
14.7
319
14.2
13.5
12.3
1.7
0.8
FY2022E
4,558
15.0
384
17.0
14.3
10.2
1.5
0.6
Source: Company, Angel Research
Stock Info
CMP
174
TP
204
Upside
17.2%
Sector
IT
Market Cap (` cr)
3,923
Beta
0.7
52 Week High / Low
230 /64
3 year-Chart
Source: Company, Angel Research
-
50
100
150
200
250
300
350
Aug-16
Dec-16
Apr-17
Jul-17
Nov-17
Mar-18
Jul-18
Nov-18
Mar-19
Jul-19
Nov-19
Mar-20
Jul-20
Stock Info
CMP
1,831
TP
2,087
Upside
14.0%
Sector
Agro Chemicals
Market Cap (` cr)
27,787
Beta
0.7
52 Week High / Low
1,870/973
3 year-Chart
Source: Company, Angel Research
-
200
400
600
800
1,000
1,200
1,400
1,600
1,800
2,000
May-17
Aug-17
Dec-17
Mar-18
Jul-18
Oct-18
Feb-19
May-19
Sep-19
Dec-19
Mar-20
Jul-20
6
Error!
Refer
ence
sourc
Angel Top Picks | August 2020
August 5, 2020
6
L&T Infotech
L&T InfoTech (LTI) is one of the fastest growing mid cap IT Company in India.
IT is part of the L&T group and provides services like ADM, Enterprise
solutions, Infrastructure management services etc.
Company has a very strong presence to the BFSI & manufacturing verticals,
which accounts for ~45% and 17.5% of the company’s revenues and are
amongst the least impacted vertical due to the shutdown on account of Covid -
19. The company doesn't have a very large exposure to service oriented
verticals like travel & Tourism which are amongst the worst impacted due to
the Covid – 19 outbreak.
LTI has been growing significantly faster than both mid and large cap peers
have over the past few years on the back of strong deal wins and we expect
the outperformance to continue for the company.
Key Financials
Y/E
Sales
OPM
PAT
EPS
ROE
P/E
P/BV
EV/Sales
March
(` cr)
(%)
(` cr)
(`)
(x)
(%)
(%)
(x)
FY2021E
12,166
19.7
1,723
99.0
0.2
24.7
6.0
3.2
FY2022E
13,974
19.2
1,975
113.5
0.2
21.6
5.0
2.7
Source: Company, Angel Research
Galaxy Surfactants
Galaxy Surfactants is a market leader in oleo chemical-based surfactants,
which is used in personal and home care products including skin care, oral
care, hair care, cosmetics, toiletries and detergent products.
The company has been increasing its share of high margin specialty care
products in its portfolio which now accounts for ~ 40% of its revenues while
the balance is accounted for by the performance surfactant business.
Company has very strong relationship with MNC clients like Unilever, P&G,
Henkel, Colgate-Palmolive and supplies raw materials to them not only in
India but also in US, EU and MENA region.
Though the company’s operations had been impacted due to the Covid-19
outbreak in April management has highlighted that operations have improved
significantly in May and June given that their supply is predominantly to the
FMCG sector.
Key Financials
Y/E
Sales
OPM
PAT
EPS
ROE
P/E
P/BV
EV/Sales
March
(` cr)
(%)
(` cr)
(`)
(%)
(x)
(x)
(x)
FY2021E
2,555
13.9
207
58.5
0.2
28.4
4.9
2.4
FY2022E
2,993
13.8
248
70.0
0.2
23.7
4.2
2.0
Source: Company, Angel Research
Stock Info
CMP
1,661
TP
1,800
Upside
8.4%
Sector
Chemicals
Market Cap (` cr)
5,888
Beta
0.6
52 Week High / Low
1,790/975
3 year-Chart
Source: Company, Angel Research
-
200
400
600
800
1,000
1,200
1,400
1,600
1,800
Feb-18
Apr-18
Jul-18
Oct-18
Dec-18
Mar-19
Jun-19
Aug-19
Nov-19
Jan-20
Apr-20
Jul-20
Stock Info
CMP
2,447
TP
2,838
Upside
16.0%
Sector
IT
Market Cap (` cr)
42,686
Beta
0.7
52 Week High / Low
2,500/1,207
3 year-Chart
Source: Company, Angel Research
-
500
1,000
1,500
2,000
2,500
3,000
May-17
Aug-17
Dec-17
Mar-18
Jul-18
Oct-18
Feb-19
May-19
Sep-19
Dec-19
Mar-20
Jul-20

7
Error!
Refer
ence
sourc
Angel Top Picks | August 2020
August 5, 2020
7
IPCA Laboratories
IPCA’s 54% of revenue comes from domestic generic and API business.
Generics and API continues to provide revenue growth for Ipca. Expected to
outperform the Indian Pharmaceutical market (IPM) by 8%-10% p.a in FY 22.
EU generic & branded which account for 15% of the company’s revenues are
on growth trajectory along with higher margins (40% EBITDA margins).
Current capacity utilization of plants which supply to Europe is at 20% which is
expected to ramp up from current levels. We expect the European business to
show 30-35% PAT growth.
Ipca manufacture over 350 formulations and 80 APIs for various therapeutic
segments like Pain management. Currently the company has 18 ANDA
sapprovals, 46 ANDA filled with authorities while 8 products are in clinical
trials.
Britannia Industries
Britannia Industries (BRIT)’s principal activity is manufacture and sale of
biscuits, bread, rusk, cakes and dairy products.
BRIT has brands like Tiger, Good-Day, and 50:50 under its fold with an
estimated market share of 33% in the Indian biscuits industry. Biscuits
contribute more than 80% of the company’s turnover.
BRIT has an overall distribution reach of 5.5 million outlets. With consistent
focus on distribution expansion, BRIT has narrowed the gap with the No. 1
player. The gap with largest distributed brand is now just 0.8 million outlets.
In Q4FY20 BRIT have outperformed other companies in FMCG space with
YOY growth of 2.5%/20bp/27% in Revenue/EBITDA/PAT respectively. Going
ahead in near term, food industry is witnessing a shift from dining out/ street
food to home consumption. BRIT being a low price product with trusted brands
is well positioned to cater the shift.
Stock info
CMP
1,987
TP
2,400
Upside
20.8%
Sector
Pharma
Market Cap (` cr)
25,106
Beta
0.3
52 Week High / Low
2,032/844
3 year-Chart
Source: Company, Angel Research
Key Financials
Y/E
Sales
OPM
PAT
EPS
ROE
P/E
P/BV
EV/Sales
March
(` cr)
(%)
(` cr)
(`)
(%)
(x)
(x)
(x)
FY2021E
5181
21.7%
711
56.8
16.7
35.0
5.9
4.0
FY2022E
6217
22.7
953
76.3
18.2
26.0
5.0
3.3
Source: Company, Angel Research
Stock Info
CMP
3,817
TP
4,220
Upside
10.6%
Sector
FMCG
Market Cap (` cr)
91,846
Beta
0.9
52 Week High / Low
4,015/2,100
3 year-Chart
Source: Company, Angel Research
Key Financials
Y/E
Sales
OPM
PAT
EPS
ROE
P/E
P/BV
EV/Sales
March
(` cr)
(%)
(` cr)
(`)
(%)
(x)
(x)
(x)
FY2021E
13,269
17.6
1712.0
71.2
29.5
53.6
20.3
6.7
FY2022E
14,623
16.5
1753.0
72.9
28.6
52.4
18
6.0
Source: Company, Angel Research
-
500
1,000
1,500
2,000
2,500
May-17
Aug-17
Dec-17
Mar-18
Jul-18
Oct-18
Feb-19
May-19
Sep-19
Dec-19
Mar-20
Jul-20
-
500
1,000
1,500
2,000
2,500
3,000
3,500
4,000
4,500
May-17
Aug-17
Dec-17
Mar-18
Jul-18
Oct-18
Feb-19
May-19
Sep-19
Dec-19
Mar-20
Jul-20
8
Error!
Refer
ence
sourc
Angel Top Picks | August 2020
August 5, 2020
8
HDFC Ltd.
HDFC has sufficient capital (Tier-1 -16.2%) and Liquidity (Rs.30,000cr) to tide
over this situation.
HDFC’s superior know how of the segment; strict underwriting practices and
buffer provision would help it to better manage the credit loss. Morat from
non-individual segment remained steady at 40%, however; only 10% has not
paid any EMI, rest has paid some or part
As per NHB norms, HDFC is required to carry total provision of Rs. 4,452cr,
against which actual provisions as of Q1FY2021 were at Rs. 12,285cr, which
is over and above regulatory requirement and provides investor comfort.
HDFC is currently available at ~1.4x its FY2022E BV, which we
believe is reasonable considering its robust operating metrics, experience
management, Healthy provision and sustainable business model.
ICICI Bank
The Ability to raise sufficient liquidity at Low cost would be The Key criteria for
banks to navigate the current situation, as asset side inflow would be volatile.
ICICI Bank is clearly better positioned in the liability side (in Q1FY21, Deposit
grew 21% yoy and CASA ratio of 42.5%). Moratorium % reduced from 30% to
17.7% in phase 2 and bank has provision worth of Rs.8,280cr (7.4% of Morat
value).
Strong liability franchise, Healthy asset mix, higher than 70% provision for bad
asset and More than 80% of incremental lending to high rated corporate
provide comfort.
ICICI Bank is trading (Core Banking Business – 1.1x FY22ABV) at a significant
discount to historical average valuations and offers favourable risk reward
from current levels.
Stock Info
CMP
1,780
TP
2,075
Upside
16.6%
Sector
Banking
Market Cap (` cr)
308,638
Beta
1.3
52 Week High / Low
2,500/1,473
3 year-Chart
Source: Company, Angel Research
Key Financials
Y/E
Op. Inc
NIM
PAT
EPS
ABV
ROA
ROE
P/E
P/ABV
March
(` cr)
(%)
(` cr)
(`)
(`)
(%)
(%)
(x)
(x)
FY2021E
12,389
3.4
9,329
54
543
1.3
10
33
3.3
FY2022E
14,054
3.4
10,140
59
590
1.7
12
30
3.0
Source: Company, Angel Research
Stock Info
CMP
351
TP
410
Upside
16.8%
Sector
Banking
Market Cap (` cr)
227,347
Beta
1.5
52 Week High / Low
552/269
3 year-Chart
Source: Company, Angel Research
Key Financials
Y/E
Op. Inc
NIM
PAT
EPS
ABV
ROA
ROE
P/E
P/ABV
March
(`cr)
(%)
(`cr)
(`)
(`)
(%)
(%)
(x)
(x)
FY2021E
37,170
3.6
9,919
15
177
0.9
8
23
2.0
FY2022E
39,737
3.7
14,714
23
195
1.2
11
16
1.8
Source: Company, Angel Research
-
500
1,000
1,500
2,000
2,500
3,000
May-17
Aug-17
Dec-17
Mar-18
Jul-18
Oct-18
Feb-19
May-19
Sep-19
Dec-19
Mar-20
Jul-20
-
100
200
300
400
500
600
May-17
Aug-17
Dec-17
Mar-18
Jul-18
Oct-18
Feb-19
May-19
Sep-19
Dec-19
Mar-20
Jul-20
9
Error!
Refer
ence
sourc
Angel Top Picks | August 2020
August 5, 2020
9
Aarti Industries
Aarti Industries is the lowest cost producer in Benzene based derivatives.
Company accounts for 20% of world’s Nitrochloro Benzene (NCB) and 10% of
dichloride benzene (DCB) capacity.
Company has been constantly increasing its share of high margin downstream
products which now accounts for 70% of the company’s revenues. Company is
expanding its NCB capacity which would be utilized for manufacture of high
margins downstream products.
Company is well diversified across product, customer, geography and end
user industry and is not likely to be impacted too much from the Covid-19
outbreak. Exports account for 40% of revenues while balance 60% is from
domestic sales. Significant opportunity for company arising from
environmental related issues in China and companies looking to diversify
supply chains.
Endurance Tech.
It mainly caters to two and three-wheeler OEMs in India and supplies
aluminum casting products to four-wheeler OEMs in Europe.
The company operates 17 plants in India, 9 plants overseas and 4 R&D sites
Post Covid19, evolving consumer preference for lower ticket priced means of
private transport amid pressurized incomes & awareness around social
distancing are expected to act as tailwinds for domestic 2-Ws in India, 4-Ws
across developed nations.
Going ahead, given the company’s ability to gain new businesses & market
share across categories; we recommend a buy for Endurance.
Stock Info
CMP
1,043
TP
1,165
Upside
11.7%
Sector
Chemicals
Market Cap (` cr)
18,177
Beta
0.8
52 Week High / Low
1,192/662
3 year-Chart
Source: Company, Angel Research
Key Financials
Y/E
Sales
OPM
PAT
EPS
ROE
P/E
P/BV
EV/Sales
March
(` cr)
(%)
(` cr)
(`)
(%)
(x)
(x)
(x)
FY2021E
4555
22.7
542
30.3
16.7
34.4
5.4
3.9
FY2022E
5793
23.4
746
42.0
20.3
24.8
4.7
3.1
Source: Company, Angel Research
Stock Info
CMP
927
TP
1,110
Upside
19.7%
Sector
Others
Market Cap (` cr)
13,027
Beta
0.4
52 Week High / Low
1,202 /562
3 year-Chart
Source: Company, Angel Research
Key Financials
Y/E
Sales
OPM
PAT
EPS
ROE
P/E
P/BV
EV/Sales
March
(` cr)
(%)
(` cr)
(`)
(%)
(x)
(x)
(x)
FY2021E
5664
14.0
290.0
20.6
14.0
44.8
4.6
1.9
FY2022E
7024
15.8
523.0
37.2
16.5
24.8
3.6
1.7
Source: Company, Angel Research
-
200
400
600
800
1,000
1,200
May-17
Aug-17
Dec-17
Mar-18
Jul-18
Oct-18
Feb-19
May-19
Sep-19
Dec-19
Mar-20
Jul-20
-
200
400
600
800
1,000
1,200
1,400
1,600
1,800
May-17
Aug-17
Dec-17
Mar-18
Jul-18
Oct-18
Feb-19
May-19
Sep-19
Dec-19
Mar-20
Jul-20
10
Error!
Refer
ence
sourc
Angel Top Picks | August 2020
August 5, 2020
10
Reliance Industries
Reliance Industries Ltd. (RIL) is India’s largest company with dominant
presence in Refining, Petrochemicals, Telecom and Retail businesses.
RIL has built up a dominant telecom business and has already attained market
leader status with 38.3 cr. subscribers at the end of Q4FY20. Telecom
business to witness robust growth over next few years due to tariff hikes and
shift of subscribers from Vodafone Idea to other telecom players.
RIL has also built a very strong retail business which is the largest organized
retailing company in India. We expect the retail business to be a key value
driver for Reliance over the long run though there would be some impact on
business in FY21 due to the Covid 9 outbreak.
The company has raised INR 1.52lakh cr. from marquee investors like
Facebook, General Atlantic, KKR, Intel etc reaffirms our conviction in the
company’s potential transformation to a digital play from a pure brick and
mortar company.
Swaraj Engines
Swaraj Engines is engaged in the business of manufacturing diesel engines
and hi-tech engine components. Diesel Engines are specifically designed for
tractor application.
Going forward, we expect recovery in tractor industry (due to robust Rabi crop
production, hike in MSP & the forecast of a normal monsoon) will benefit
player like Swaraj Engines.
The company has healthy balance sheet along with free cash flow and higher
profitability. The company is trading at reasonably lower valuations
Stock Info
CMP
2,151
TP
2,277
Upside
5.9%
Sector
Diversified
Market Cap (` cr)
1,415,726
Beta
1.1
52 Week High / Low
2,198 /867
3 year-Chart
Source: Company, Angel Research
Key Financials
Y/E
Sales
OPM
PAT
EPS
ROE
P/E
P/BV
EV/Sales
March
(` cr)
(%)
(` cr)
(`)
(%)
(x)
(x)
(x)
FY2021E
3,34,223
12.7
26,360
41.6
5.7
51.7
2.9
8.2
FY2022E
4,24,086
14.0
42,035
66.3
8.7
32.4
2.8
6.4
Source: Company, Angel Research (Standalone nos.)
Stock Info
CMP
1,398
TP
1,665
Upside
19.1%
Sector
Others
Market Cap (` cr)
1,696
Beta
0.5
52 Week High / Low
1,549/807
3 year-Chart
Source: Company, Angel Research
Key Financials
Y/E
Sales
OPM
PAT
EPS
ROE
P/E
P/BV
EV/Sales
March
(` cr)
(%)
(` cr)
(`)
(%)
(x)
(x)
(x)
FY2021E
781
16.7
71
58.6
17.9
23.9
4.4
2.2
FY2022E
899
17.0
86
71.2
17.0
19.6
3.4
1.9
Source: Company, Angel Research
-
500
1,000
1,500
2,000
2,500
May-17
Aug-17
Dec-17
Mar-18
Jul-18
Oct-18
Feb-19
May-19
Sep-19
Dec-19
Mar-20
Jul-20
-
500
1,000
1,500
2,000
2,500
3,000
May-17
Aug-17
Dec-17
Mar-18
Jul-18
Oct-18
Feb-19
May-19
Sep-19
Dec-19
Mar-20
Jul-20
11
Error!
Refer
ence
sourc
Angel Top Picks | August 2020
August 5, 2020
11
IDFC First Bank
The Ability to raise sufficient liquidity at Low cost would be The Key criteria for
banks to navigate the current situation, as asset side inflow would be limited.
IDFC Fist Bank, Post management change has clearly outperformed in
building liability franchise and retail lending.
Since new management took charge, every qtr. liability franchise has been
strengthened. CASA ratio improved from 10.4% in Q3FY19 to 33.7% In
Q1FY21. NIM has improved to 4.53% in Q1FY21 as compared to 4.24% in
Q4 FY20 and 2.89% in Q3FY19. Retail advance mix is continuously
improving.
The Bank had raised Rs. 2,000 crores of fresh equity capital during Q1FY21.
Post the capital raise, the Capital Adequacy Ratio will be 15.03% with CET-1
Ratio of 14.58%.
We believe efforts to build a liability franchise, fresh capital infusion, and
provision taken on the wholesale books will help to tide over this difficult time.
The IDFC First Bank is trading (0.8 x FY22ABV) at a significant discount to
historical average valuations.
Stock Info
CMP
27
TP
32
Upside
18.5%
Sector
Banking
Market Cap (` cr)
15,173
Beta
1.2
52 Week High / Low
48 /18
3 year-Chart
Source: Company, Angel Research
Key Financials
Y/E
NII
NIM
PAT
EPS
ABV
ROA
ROE
P/E
P/ABV
March
(` cr)
(%)
(` cr)
(`)
(`)
(%)
(%)
(x)
(x)
FY2021E
6,939
4.8
90
0.2
29
0.1
1
170
0.9
FY2022E
8,121
5.3
1,530
2.7
31
0.9
8
10
0.9
Source: Company, Angel Research
-
10
20
30
40
50
60
70
80
May-17
Aug-17
Dec-17
Mar-18
Jul-18
Oct-18
Feb-19
May-19
Sep-19
Dec-19
Mar-20
Jul-20

12
Error!
Refer
ence
sourc
Angel Top Picks | August 2020
August 5, 2020
12
Changes in Recommendation
Exhibit 1: Stocks on Hold
Stock name
Hold Date
Hold Price
Jindal Steel
05-10-2019
94
Source: Company, Angel Research
Hold – While we recommend to Hold on to existing positions at current level, we would await
for further data points before recommending any fresh purchases.
Exhibit 2: Stocks bought in last 6-months
Stock Name
Buy Call Date
Buy Price
Asian Paints
11-03-2020
1,864
Bata India
13-03-2020
1,411
Hind. Unilever
30-03-2020
2,141
Avenue Super.
30-03-2020
2,028
Colgate-Palm.
30-03-2020
1,164
Nestle India
30-03-2020
15,110
Dr Lal Pathlabs
01-04-2020
1,384
P & G Hygiene
01-04-2020
10,161
Ipca Labs.
01-04-2020
1,398
Bharti Airtel
01-04-2020
421
Dabur India
16-04-2020
498
L & T Infotech
16-04-2020
1,493
Infosys
16-04-2020
626
Britannia Inds.
16-04-2020
2,832
Alkem Lab
17-04-2020
2,688
Reliance Inds.
17-04-2020
1,189
P I Inds.
24-04-2020
1,507
Galaxy Surfact.
24-04-2020
1,394
Aarti Inds.
24-04-2020
929
Dhanuka Agritech
07-05-2020
438
Hind. Unilever
08-05-2020
2,056
Dr Reddy's Labs
28-05-2020
3,877
H D F C
01-06-2020
1,740
Larsen & Toubro
01-06-2020
951
Escorts
01-06-2020
970
ICICI Bank
01-06-2020
345
Axis Bank
03-06-2020
424
Bajaj Fin.
03-06-2020
2,477
Can Fin Homes
03-06-2020
316
Endurance Tech.
08-06-2020
838
Swaraj Engines
08-06-2020
1,290
Persistent Sys
29-07-2020
885
Zensar Tech.
29-07-2020
155
Alembic Pharma
04-08-2020
1,023
Source: Company, Angel Research

13
Error!
Refer
ence
sourc
Angel Top Picks | August 2020
August 5, 2020
13
Exhibit 3: Stocks sold in last 6-months
Stock Name
Sell Date
Sell Price
Parag Milk Foods
01-02-2020
137
Bata India
07-02-2020
1,880
Larsen & Toubro
25-02-2020
1,250
Aditya Birla Cap
06-03-2020
75
Dr Lal Pathlabs
09-04-2020
1,462
RBL Bank
15-04-2020
121
Shriram Trans.
15-04-2020
685
KEI Inds.
16-04-2020
279
Safari Inds.
16-04-2020
402
Amber Enterp.
16-04-2020
1,116
UltraTech Cem.
21-04-2020
3,409
Inox Wind
24-04-2020
27
Hind. Unilever
04-05-2020
2,121
ICICI Bank
05-05-2020
341
Dabur India
06-05-2020
450
Asian Paints
07-05-2020
1,610
Hawkins Cookers
22-05-2020
4,235
Bata India
26-05-2020
1,265
GMM Pfaudler
26-05-2020
3,732
Alkem Lab
27-05-2020
2,425
Dhanuka Agritech
27-05-2020
573
Nestle India
08-06-2020
17,160
P & G Hygiene
08-06-2020
10,150
Infosys
08-06-2020
708
Hind. Unilever
08-07-2020
2,161
Avenue Suparmart
13-07-2020
2,210
Axis Bank
14-07-2020
423
Bajaj Finance
21-07-2020
3,255
Larsen & Toubro
28-07-2020
913
Colgate-Palmolive
29-07-2020
1,413
Escorts
03-08-2020
1,110
Source: Company, Angel Research

14
Error!
Refer
ence
sourc
Angel Top Picks | August 2020
August 5, 2020
14
Research Team Tel: 022 - 39357800 E-mail: [email protected] Website: www.angelbroking.com
DISCLAIMER
Angel Broking Limited (hereinafter referred to as “Angel”) is a registered Member of National Stock Exchange of India Limited, Bombay
Stock Exchange Limited, Metropolitan Stock Exchange Limited, Multi Commodity Exchange of India Ltd and National Commodity &
Derivatives Exchange Ltd It is also registered as a Depository Participant with CDSL and Portfolio Manager and Investment Adviser with
SEBI. It also has registration with AMFI as a Mutual Fund Distributor. Angel Broking Limited is a registered entity with SEBI for Research
Analyst in terms of SEBI (Research Analyst) Regulations, 2014 vide registration number INH000000164. Angel or its associates has not
been debarred/ suspended by SEBI or any other regulatory authority for accessing /dealing in securities Market. Angel or its
associates/analyst has not received any compensation / managed or co-managed public offering of securities of the company covered
by Analyst during the past twelve months.
This document is solely for the personal information of the recipient, and must not be singularly used as the basis of any investment
decision. Nothing in this document should be construed as investment or financial advice. Each recipient of this document should
make such investigations as they deem necessary to arrive at an independent evaluation of an investment in the securities of the
companies referred to in this document (including the merits and risks involved), and should consult their own advisors to determine
the merits and risks of such an investment.
Reports based on technical and derivative analysis center on studying charts of a stock's price movement, outstanding positions and
trading volume, as opposed to focusing on a company's fundamentals and, as such, may not match with a report on a company's
fundamentals. Investors are advised to refer the Fundamental and Technical Research Reports available on our website to evaluate the
contrary view, if any
The information in this document has been printed on the basis of publicly available information, internal data and other reliable
sources believed to be true, but we do not represent that it is accurate or complete and it should not be relied on as such, as this
document is for general guidance only. Angel Broking Limited or any of its affiliates/ group companies shall not be in any way
responsible for any loss or damage that may arise to any person from any inadvertent error in the information contained in this report.
Angel Broking Limited has not independently verified all the information contained within this document. Accordingly, we cannot testify,
nor make any representation or warranty, express or implied, to the accuracy, contents or data contained within this document. While
Angel Broking Limited endeavors to update on a reasonable basis the information discussed in this material, there may be regulatory,
compliance, or other reasons that prevent us from doing so.
This document is being supplied to you solely for your information, and its contents, information or data may not be reproduced,
redistributed or passed on, directly or indirectly.
Neither Angel Broking Limited, nor its directors, employees or affiliates shall be liable for any loss or damage that may arise from or in
connection with the use of this information.
Disclosure of Interest Statement
Top Picks
1. Financial interest of research analyst or Angel or his Associate or his relative
No
2. Ownership of 1% or more of the stock by research analyst or Angel or associates or
relatives
No
3. Served as an officer, director or employee of the company covered under Research
No
4. Broking relationship with company covered under Research
No
Ratings (Based on Expected Returns: Buy (> 15%) Accumulate (5% to 15%) Neutral (-5 to 5%)
Over 12 months investment period) Reduce (-5% to -15%) Sell (< -15%)
Hold (Fresh purchase not recommended)
